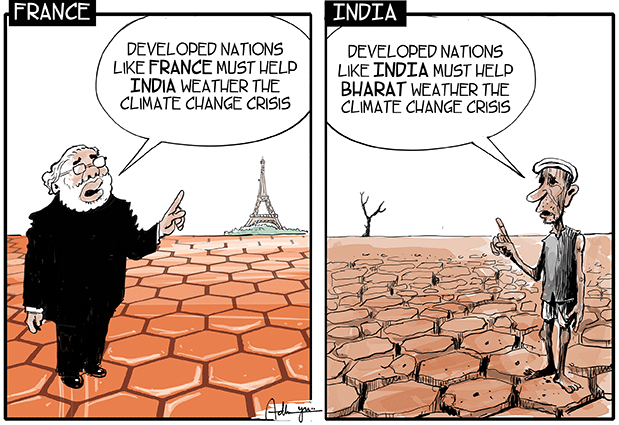
India’s PPP(Purchasing Power Parity) grows ;but Bharat's PPP(Poverty per Person) remains
Structural Fixes, and not cosmetic ones, needed...
( Its a data-heavy article; tried to be presented in simple language and in bullet-form . This practice helps the article to be precise and concise yet easy to digest the data.)
Summary: There is a chasm between India’s GDP and its income per person. Several gaps have been identified which makes it so. Example of fast growing Asian countries have been discussed to help understand our gaps better. And, policy measures -structural fixes- have been suggested to finally fill this Gap).
A. India’s Growth vs. Per Capita Income
India’s GDP Is Growing Rapidly, But Not Equally Shared
India is now the world’s 5th-largest economy by nominal GDP and 3rd-largest by PPP (purchasing power parity). GDP milestones often create excitement, but individual economic well-being is more accurately measured by per capita income.
Compared to countries like Vietnam, Bangladesh, and Indonesia, India lags in income per person despite large headline growth. India’s per capita income (~$2,500 in 2024) is ranked ~139th globally.
Over the past 30 years, India has halved extreme poverty, yet structural poverty persists. At ~$3,000 nominal per capita income, most Indians still lack access to decent housing, education, and healthcare. This paradox raises the question: How can a country grow so large economically, but remain relatively poor per person?
B. Ground Realities We need to see with data and pattern:
Regional & Structural Inequalities
Huge disparities exist between states (e.g., Bihar vs Maharashtra, or UP vs Gujarat) and between rural and urban populations.
Formalization of jobs and industries (GST, UPI, digital stack) has improved GDP accounting, but actual incomes haven’t grown uniformly.
India’s informal economy still employs 85–90% of the workforce.
Capital-Intensive vs. Labor-Intensive Growth
India’s growth has come from sectors like IT, digital services, financial services, and capital-intensive industries. These sectors contribute heavily to GDP but employ a small portion of the workforce.
In contrast, labor-intensive industries like textiles, leather, and food processing have been neglected.
The result: GDP grows, but jobs and wages don’t rise fast enough, leading to stagnation in per capita income.
Low Urbanization and Low Female Labor Participation
India’s urbanization is only ~35%, far lower than China’s (~65%) and most developed economies. Low urbanization leads to lower productivity, because rural jobs are mostly low-paying and informal.
Female labor force participation is also low (~20%), dragging down household income and national productivity.
Human Capital: The Weakest Link
Lack of quality education, vocational training, and public health systems undermines productivity. The skill gap widens between urban elites and the vast rural population.
Early childhood education, nutrition, and health are crucial to lift India's long-term productivity.
Capital Market Depth vs. Household Income
While India’s capital markets are deepening (rise of retail investors, mutual funds), this does not reflect inclusive prosperity. Only a small portion of Indians own financial assets, while the majority remain in informal, low-security jobs.
There’s a rising wealth gap: top 10% of Indians control nearly 77% of national wealth (as per Oxfam).
Demographic Advantage at Risk
India has a young population (median age ~28), which should be a growth driver. But if job creation doesn’t match workforce expansion, this demographic dividend could turn into a disaster.
The current window (till ~2040) is critical to ensure productive employment.
Policy Execution & Governance
Administrative capacity is weak in many Indian states. Without competent local governance, good policy ideas often fail in implementation. This creates vicious cycles in poor regions and virtuous cycles in high-performing ones.
Global Systems: Assisted vs Resisted Rise
The rise of China was “assisted”—it was brought into global institutions like WTO.
India's rise has been more “resisted”—facing trade barriers, visa hurdles, and geopolitical skepticism.
IMF classification keeps India in the “lower-middle income” category despite size.
C. What is Needed to Learn and Do ?
The East Asian Nations: What India Can Learn
Countries like China, Vietnam, South Korea focused on labor-intensive manufacturing exports. These countries transitioned from poor agrarian economies to industrial powerhouses in 2–3 decades.
India skipped this phase—moving from agriculture to services without a strong manufacturing base. That limits job creation for people without higher education or technical skills.
Countries like South Korea, Taiwan, Ireland, and Poland successfully escaped the middle-income trap by:
Investing in education and R&D
Promoting export-led industrialization
Attracting foreign direct investment (FDI)
Ensuring stable policy environments
Innovation and integration into global value chains are key for India to replicate this journey.
Policy and Structural Fixes Suggested :
Investment in infrastructure (transport, electricity, ports) to enable manufacturing zones.
Lower logistics costs and simplify export-related policies.
Reform land and labor laws to allow factories to scale and employ workers formally.
Government incentives for labor-intensive sectors (PLI schemes must include MSMEs).
Skilling initiatives to match youth with demand-driven job markets.
India should aim to become a production-based economy, not just consumption-driven.
“The real measure of development, “is per capita GDP improving year on year in real terms, especially for the bottom 60%.”
India has momentum—but must act fast to convert its demographic dividend into a middle-income success story.


